Industry power supply monitoring
Monitoring system for the power supply of the middle-size factory. Consists of LV source input measure point and five distributed by the territory power distribution panels (PDP).
Every measurement point is equipped by Socomec Diris A20 with communication module RS485 (Modbus RTU) and gateway Modbus RTU/TCP Mikrotik KNOT.
Using Python scripts, parameter values are sent to Zabbix and stored in a database located on a separate virtual machine.
Each measurement point transmits the following parameters:
- phase-to-neutral voltages
- phase-to-phase voltages
- phase currents
- phase powers (active and reactive)
- average voltage and current
- total powers (active, reactive and apparent)
- THD for voltages and current
- power factor (average and by phase)
- energy counters (import/export, active, reactive and apparent)
- connection quality
In case of deviation beyond defined parameters, Zabbix can send alert notifications via email, SMS, or messengers.
Grafana’s dashboards:
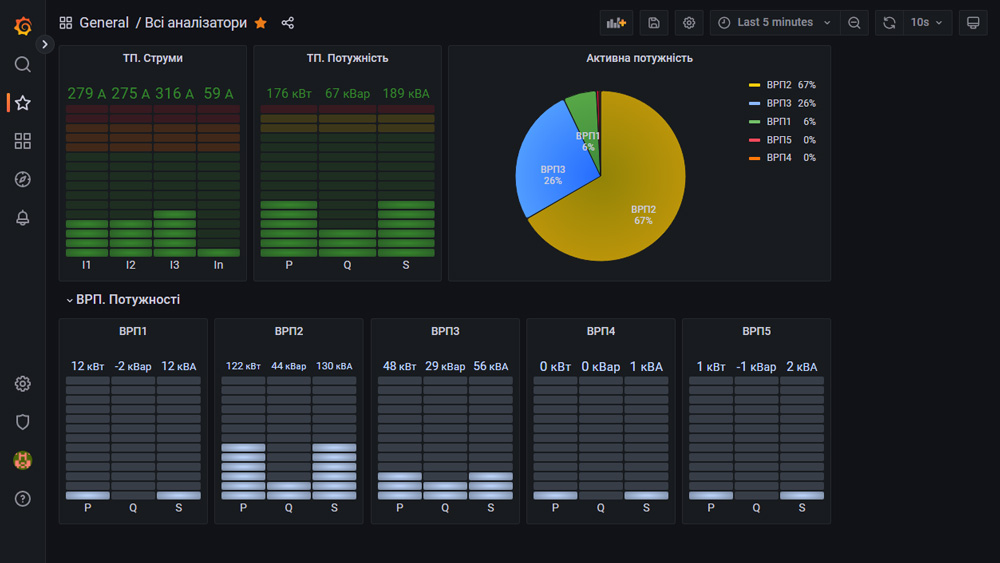
- powers by point and total power
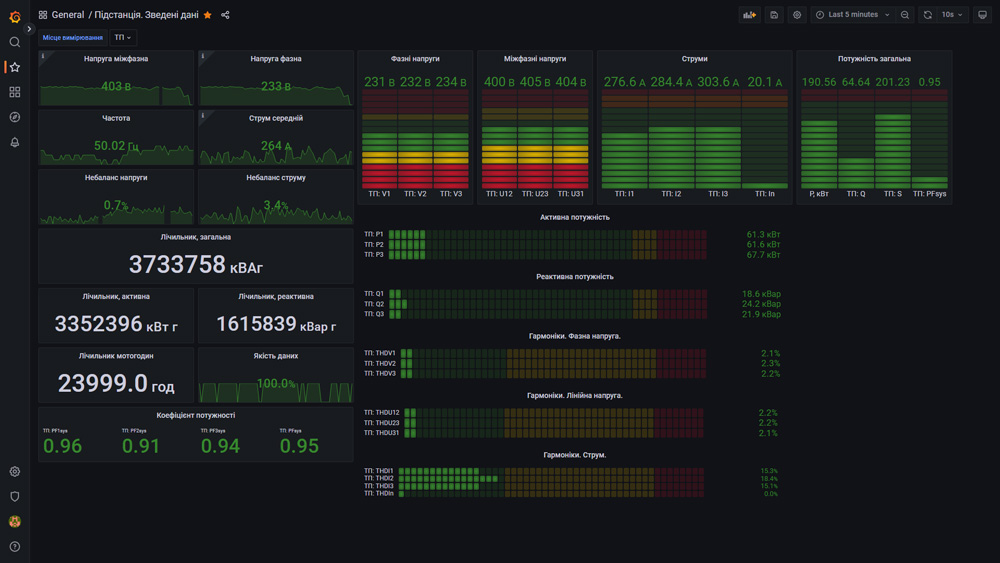
- current values of every measurement points
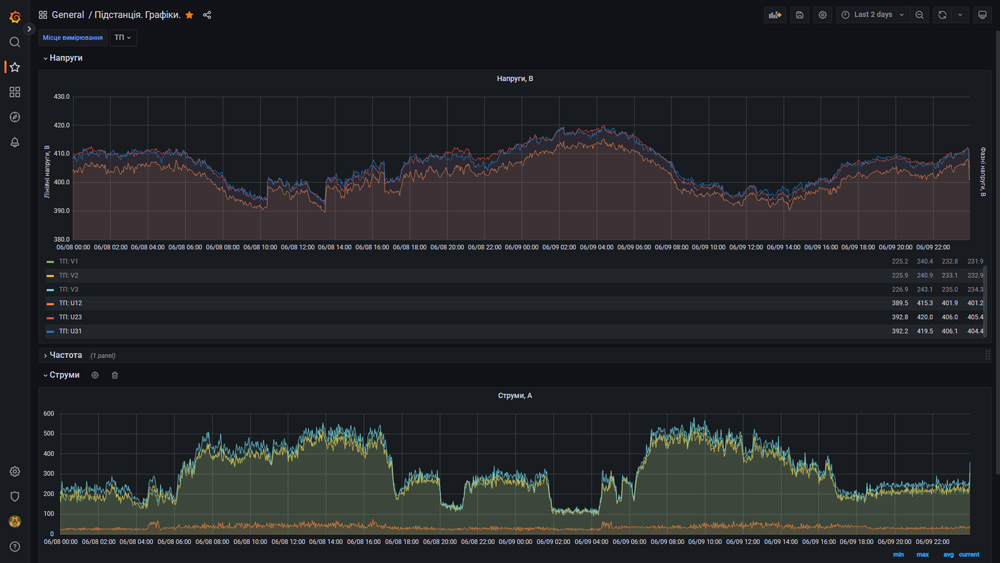
- trends and historian
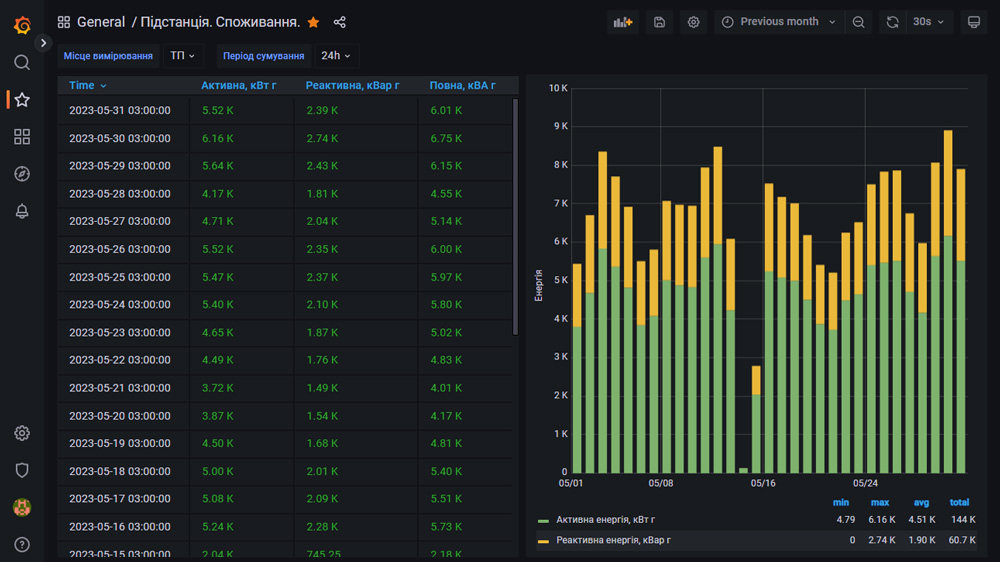
- power consumption report for every measurement point


