SCADA Monitoring REPORTING

Data acquisition, monitoring, and control systems for photovoltaic power plants, battery storage and industrial facilities.

Photovoltaic energy

Photovoltaic power plant SCADA

Monitor plant performance, track generation and inverter status, and keep operational data in one clear view.

  • Real-time data acquisition and plant overview
  • Active power control for the entire plant
  • Inverter operating modes
  • Plant operation charts, generation trends, and reporting
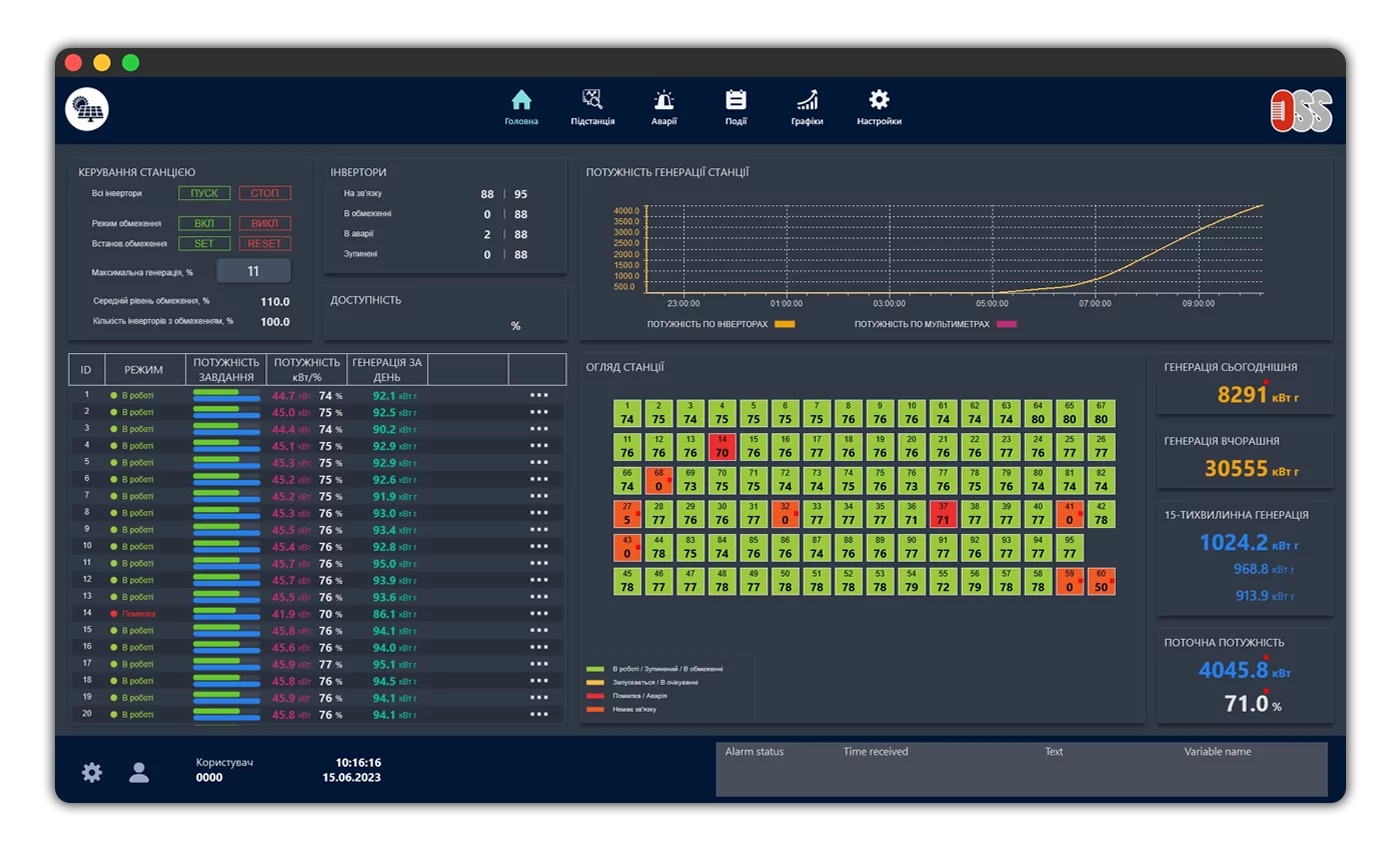
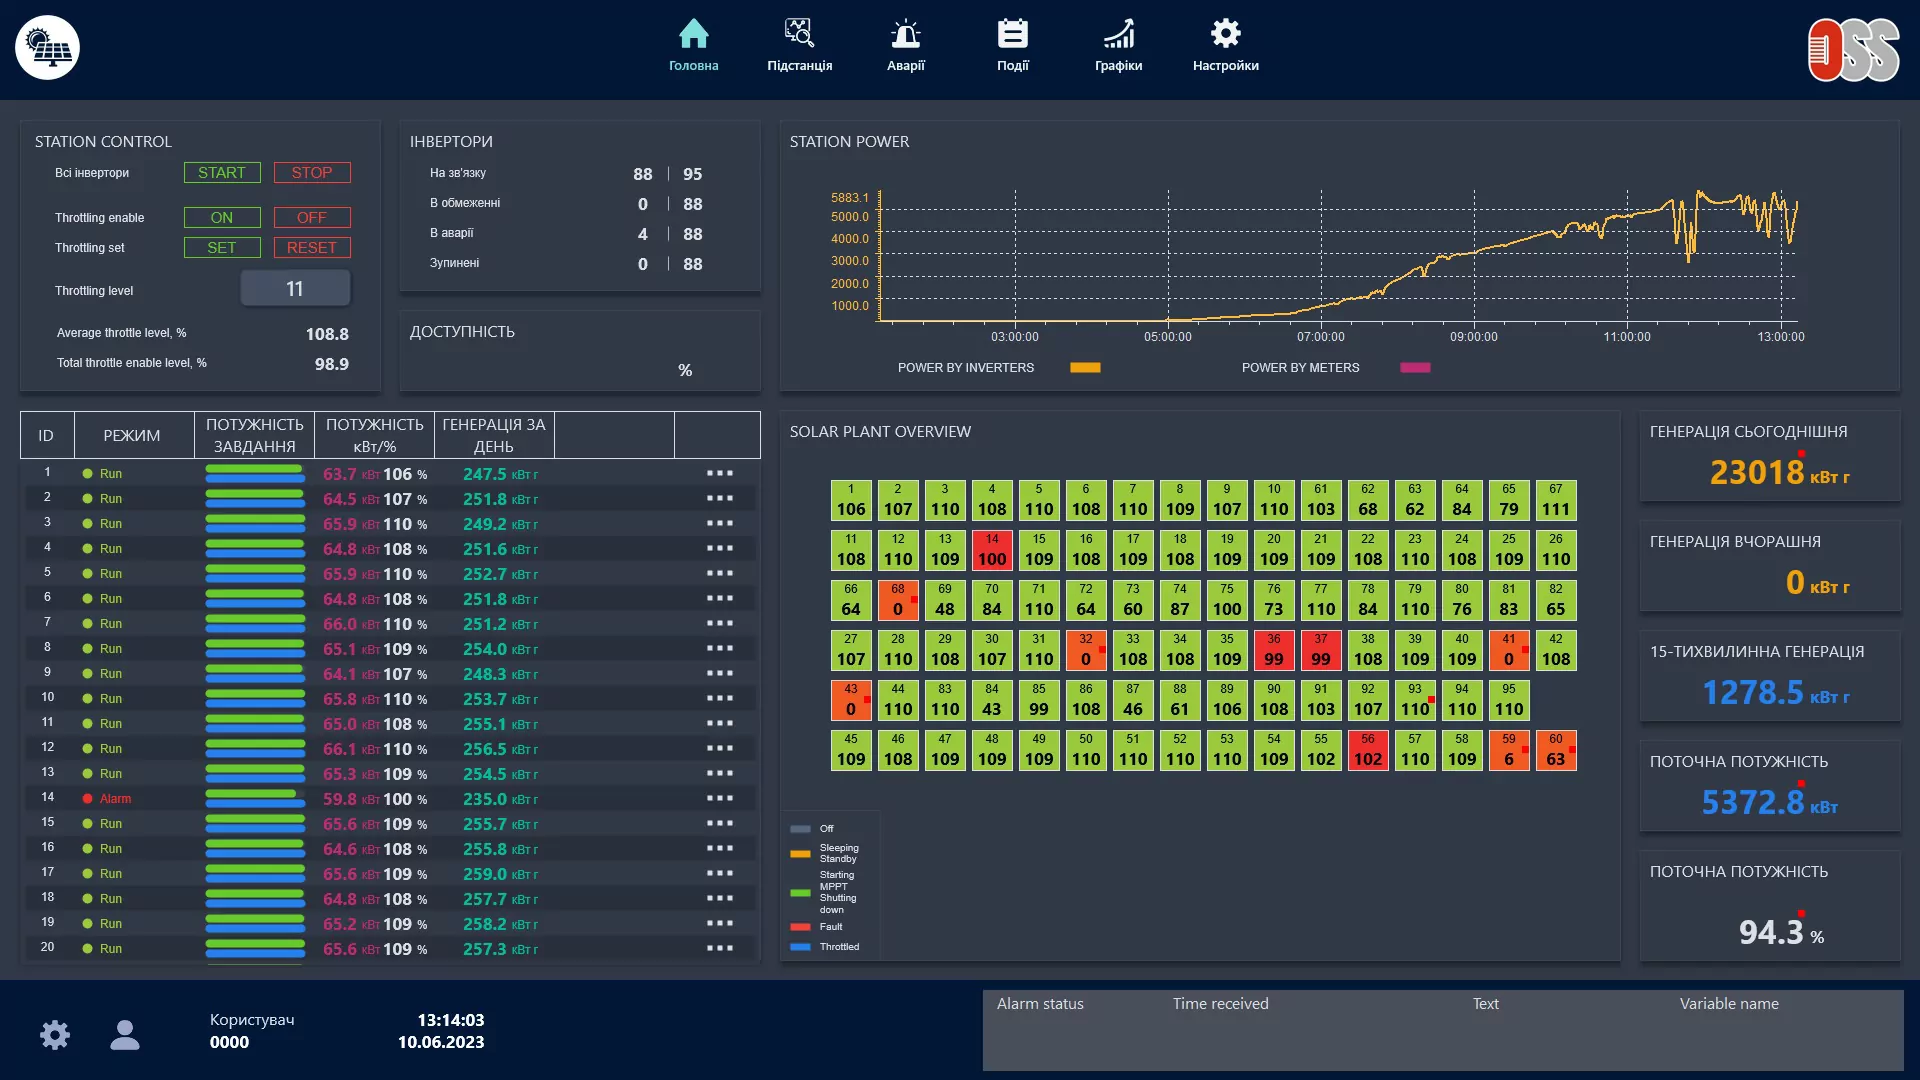
SCADA dashboard for monitoring a solar power plant
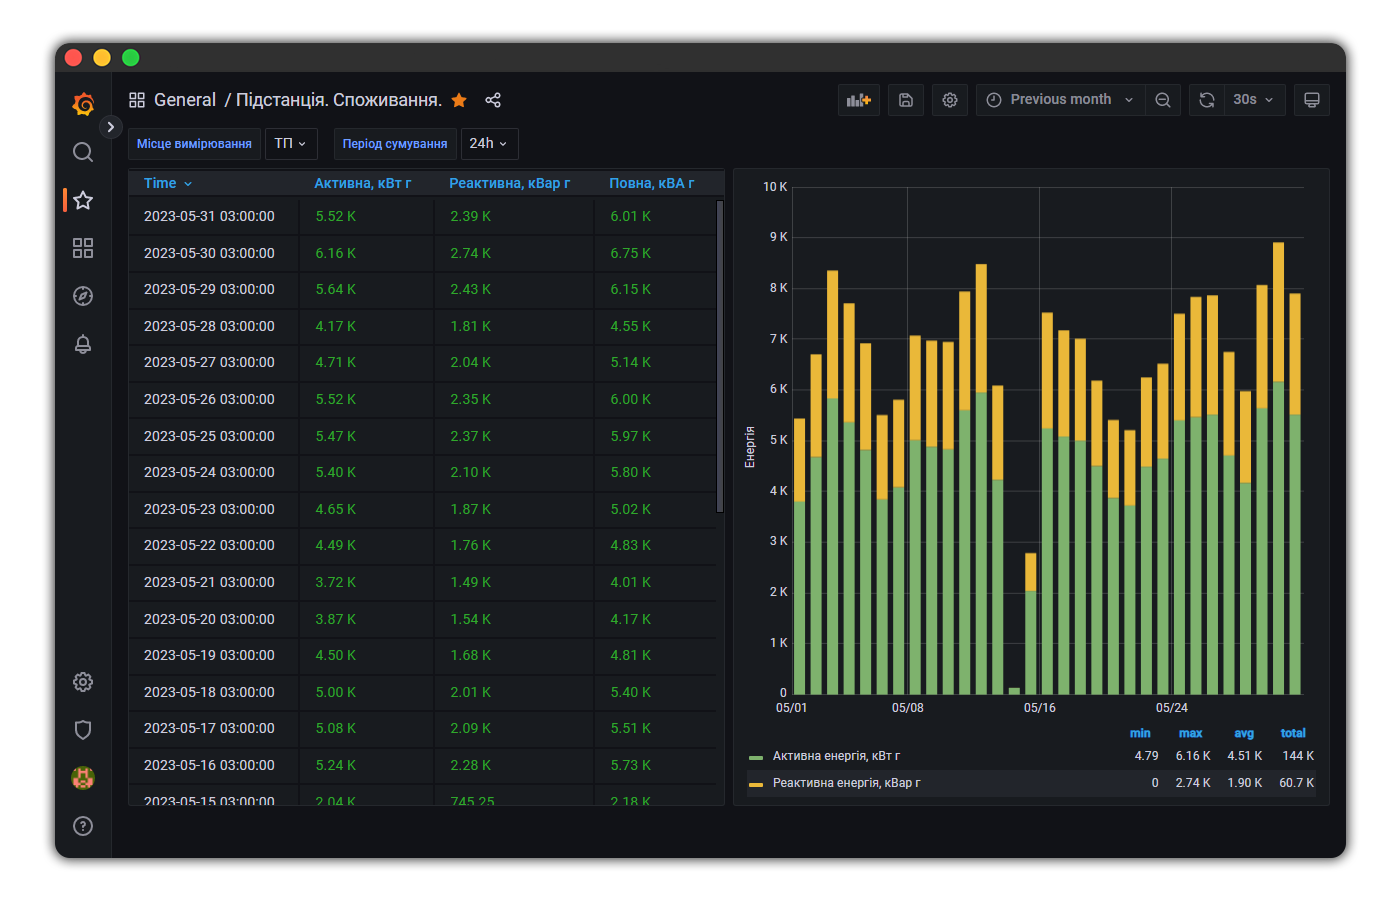
Industrial monitoring dashboard with energy trends and reports

Industrial facilities

Industrial monitoring and reporting

Bring equipment and process data together to help teams understand operations, spot changes, and make informed decisions.

  • Centralized data collection from industrial equipment
  • Live dashboards, historical trends, and event views
  • Clear reports for operational analysis

Completed projects

Selected SCADA and monitoring projects

Station dashboard and controls

Project 01

Photovoltaic

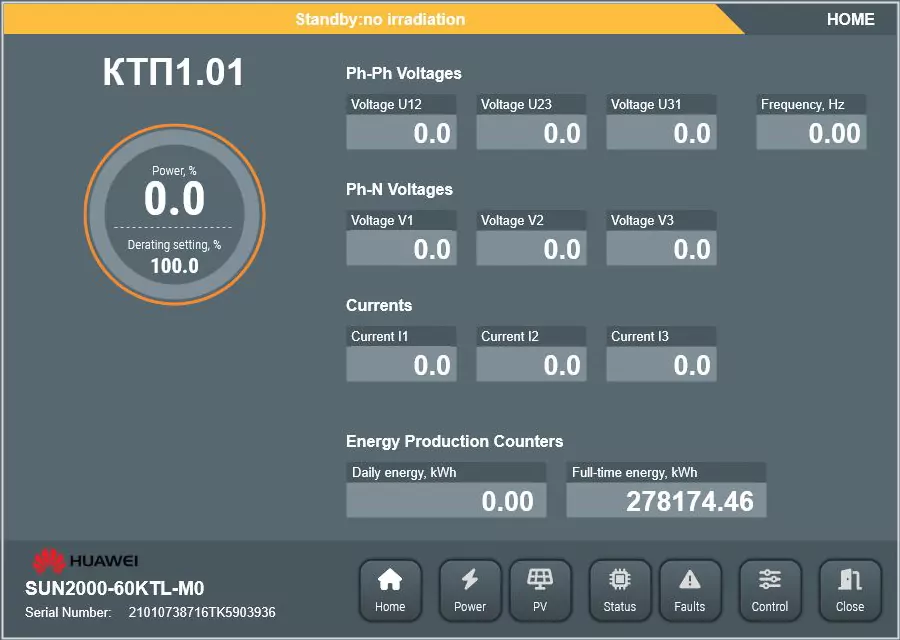
Inverter electrical live parameters overview

Project 02

Photovoltaic

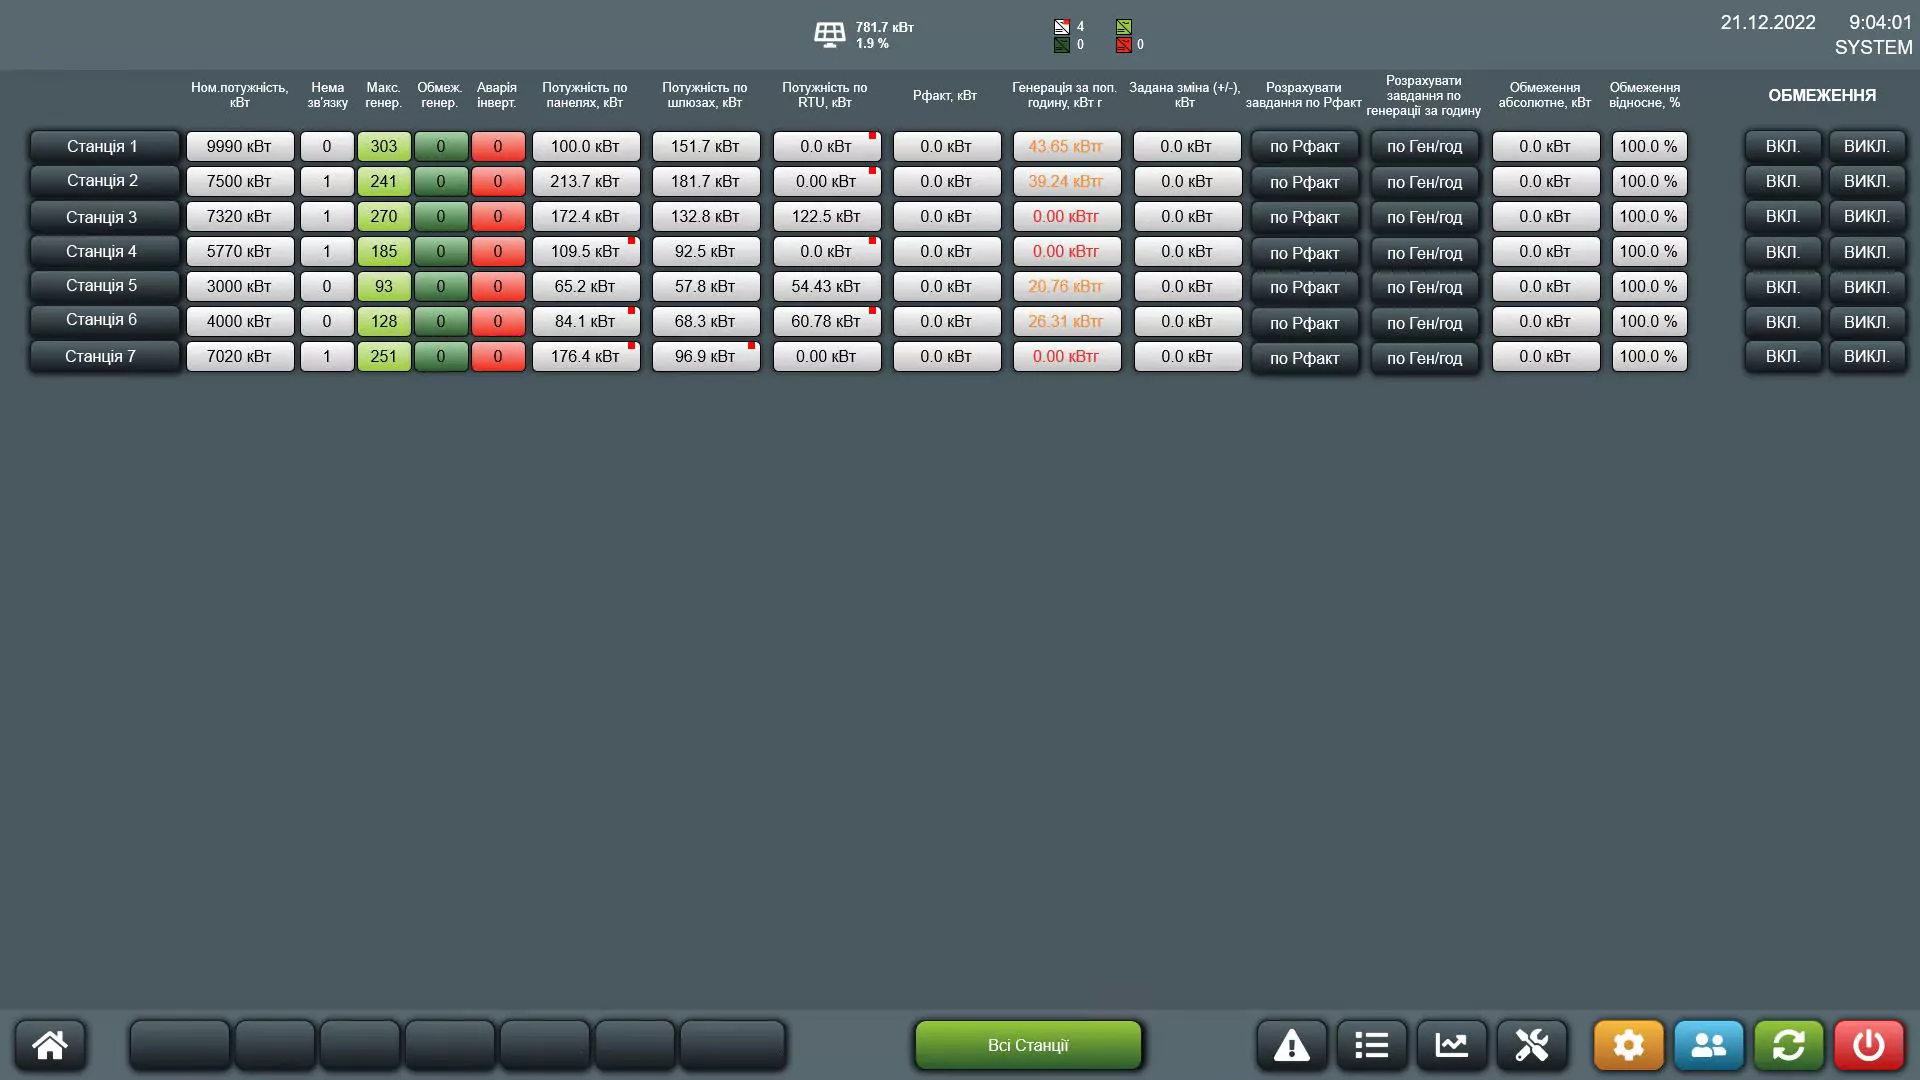
Centralized overview of photovoltaic stations

Project 03

Photovoltaic

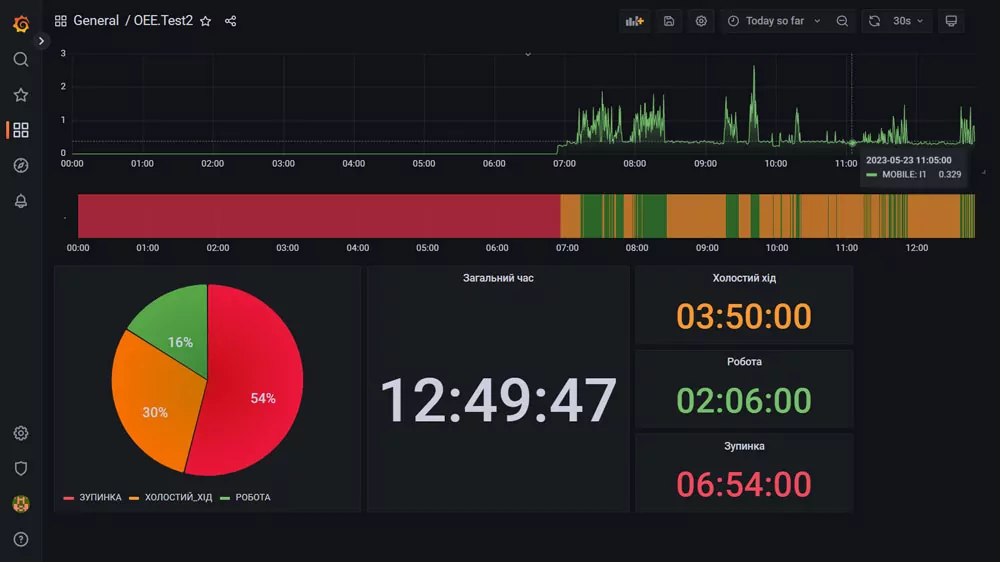
Equipment utilization dashboard

Project 04

Industrial

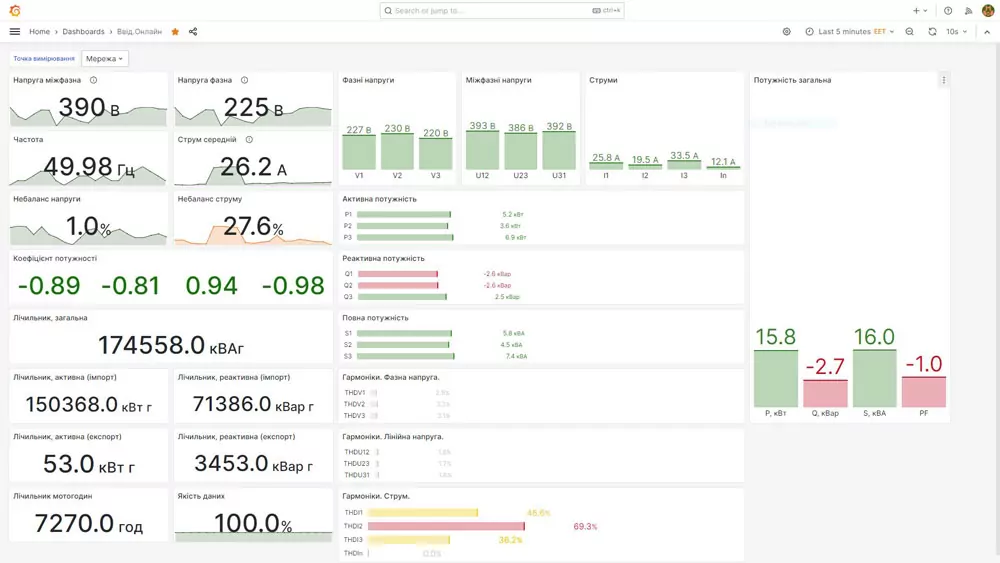
Electrical measurements overview

Project 05

Energy monitoring

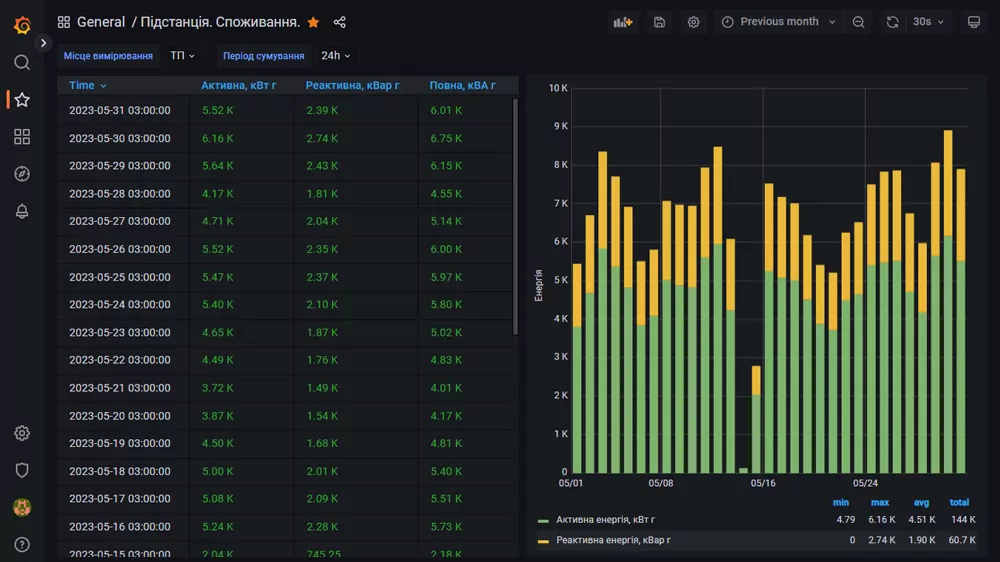
Power consumption report

Project 06

Energy monitoring

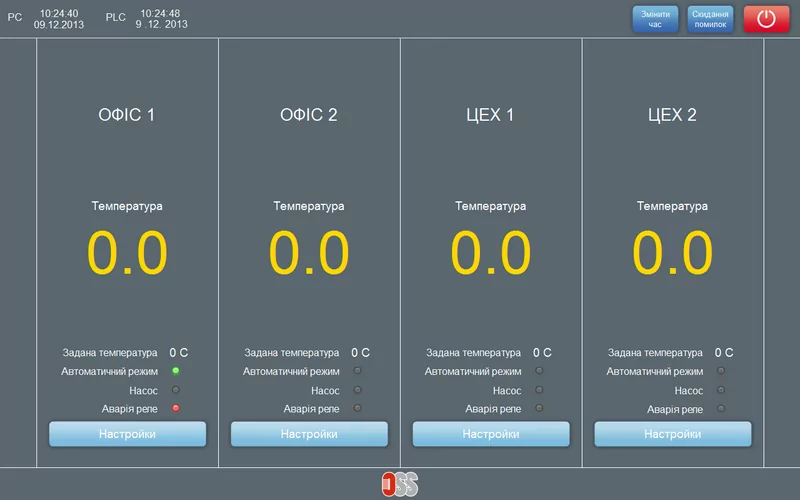
Heating system overview

Project 07

Industrial

Climate monitoring overview

Project 08

Pharmaceutical

Power monitoring dashboard

Project 09

Energy monitoring

Production monitoring overview

Project 10

Industrial

Historical temperature trend

Project 11

Industrial

Photovoltaic energy

Photovoltaic power plant SCADA

As solar power plants grow in number and size, managing different inverters and supporting equipment through separate manufacturer tools becomes increasingly complex. Remote monitoring platforms may also depend on an internet connection.

For medium and large plants, local SCADA brings plant-wide monitoring and control into one system. With the right operational requirements, the investment can pay back within the first weeks or months of operation.

Our platform

COPA-DATA zenon

We use zenon as the core platform for building open, standards-based energy applications.

Key industries

  • Food & Beverage
  • Energy & Infrastructure
  • Pharmaceutical
  • Automotive

Open standards

Built for energy-system integration

zenon supports commonly used energy protocols, helping integrate plant equipment and external systems.

  • Modbus / SunSpec
  • DNP3
  • MQTT
  • IEC 60870-5 (101/103/104)
  • IEC 61850
  • GOOSE

Multi-vendor experience

One system for the whole plant

We have experience integrating plants with Huawei and Fronius inverters, Schneider Electric equipment, and less common or unfamiliar inverter brands.

  • Huawei
    Huawei
  • Fronius
    Fronius
  • Schneider Electric
    Schneider Electric

Why local SCADA

Operate with greater visibility

  • Plant-specific control scenarios and coordinated multi-vendor inverter control
  • One interface for inverters and other plant equipment
  • Transformer and substation temperature monitoring
  • Fast access to diagnostics and on-site operation without internet

System capabilities

Configure the system around your operation

Basic features

  • Main plant dashboard with control functions
  • Dedicated equipment screens for inverters, switches, string connection boxes, and network analyzers, with settings
  • Chronological Event List (CEL) and Alarm Message List (AML)
  • Historical and real-time trends
  • Application settings

Optional features

  • Single-line diagram (SLD) and IT network status
  • Statistics, control sequences, and reports
  • Remote access
  • Cloud hosting for SCADA

Integration beyond the plant

Where required, SCADA can be integrated with third-party platforms, including exports to external databases or cloud services for visualization and analysis of accumulated data.

Plant overview and operational controls
Plant charts and equipment data

Industrial facilities

Industrial monitoring and reporting

The tasks of collecting, archiving, and visualizing production data exist in factories of all sizes and industries: from basic electricity consumption accounting, already provided to some extent by existing AMR systems, to evaluating the efficiency of production facilities (OEE). Even office centres and shopping malls need regular monitoring of resource consumption. There is also a need to monitor the health of equipment and the computer networks that transmit data to servers. To address these challenges, we use open-source software and modern approaches.

Operating system
Operating system
Virtualization platform
Database
Database
IT infrastructure monitoring
Data visualization
Data visualization
Report generation
Report generation
Scripting
Scripting
Custom applications
Custom applications

For typical monitoring tasks, such as tracking electricity consumption, temperature, and humidity, we will be happy to advise you and help select and install the necessary equipment.

Industrial monitoring charts and reports

Solar · 6 MW

Local SCADA for photovoltaic power station 6 MW

Project parameters

Zenon version
11
Tags count
~4000
Communication protocols
Modbus TCP
Other equipment
Socomec Diris A30 Mikrotik

Project description

The basic project of a local SCADA system for a solar power station is built using a ready-made Application Set distributed by Copa Data.

The necessary minimum has been implemented to ensure the operation of the power station:

  • Dashboard with general station information: current power, energy meters, list of inverters, and their status.
  • Extended inverter information panel: power, AC and DC currents and voltages, generated energy, serial number, and decoded status and error registers.
  • Single Line Diagram (SLD) for substation monitoring: power, import/export energy meters, currents, voltages (over 50 parameters), and transformer temperature.
  • Operating mode control for the entire station and each inverter individually.
  • Alarm and event logging.
  • Historian.
  • Trends.

Network equipment configuration, remote access, and network monitoring are also implemented using Zabbix and Grafana.

Generation trend
Generation trend
Station dashboard and controls
Inverter and power information
Photovoltaic power station

Zenon · SmartObject

Huawei SUN2000 photovoltaic inverter Smart Object for Zenon SCADA

Project parameters

Inverter series
Huawei SUN2000
Number of tags for each inverter
~150
Communication protocol
Modbus TCP/RTU
Minimal Zenon SCADA version
8.20

Project description

SmartObject is a Zenon technology that makes implemented objects easy to reuse, much like classes in traditional programming. A SmartObject can include tags, screens, screen templates, functions, logic, and other project components.

When a SmartObject instance is added to a project, its variables, functions, screens, and other components are created and numbered automatically, saving development time. Changes such as adding tags are then automatically updated across all instances in the project.

The SmartObject for Huawei SUN2000 series inverters provides the core functions needed for diagnostics and control:

  • Overview screen with inverter current, voltage, frequency, and meter readings.
  • DC input status, including voltage and current.
  • Power indicator screen with a graph.
  • Inverter status details: temperature, insulation resistance, efficiency, operating mode, and error codes.
  • Error register decoding with status indication.
  • Settings and control screen.
Inverter electrical live parameters overview
Inverter power screen
DC inputs voltage and current screen
Inverter state screen
Inverter settings
Inverter settings
Errors decoding screen
Inverter state screen error mode

Solar energy · Centralized dispatching

SCADA for dispatching a group of photovoltaic power plants

Project parameters

Number of inverters
> 2,000 (~100 MW)
Number of power plants
> 20
Zenon version
8.20
Number of tags
~100,000
Photovoltaic inverter series
Fronius ECO Huawei SUN2000

Project description

The dispatching system for geographically distributed solar power plants is built on the Zenon SCADA platform.

One of its main advantages over ready-made systems from equipment manufacturers is the ability to monitor and control all available equipment at the same time: inverters, analyzers, controllers, relay protection, switches, power meters, and weather stations.

The system consists of individual solar power plant projects united under one global project. It provides centralized control, key metric calculations, event and alarm logging, graph visualization, and more. Each station has its own equipment types, templates, settings, and operating algorithms, which can be changed independently of other stations.

When power plants follow a typical design, as is often the case within one organization, a new station can usually be added by copying an existing project and making minor settings changes. This makes it possible to add another power plant to the SCADA system within hours.

Features

  • Dashboards for visualizing key station metrics.
  • Overall station management dashboard.
  • Alarm and event logging.
  • Historian.
  • Trends.

Every power plant project contains

  • Interactive diagram with a map of inverters.
  • Single Line Diagram (SLD).
  • Detailed inverter panel showing power, AC and DC currents and voltages, generated energy, serial number, and decoded status and error registers.
  • Control window for the entire station and individual sections or substations.
  • Settings window.

The project also includes IT/OT infrastructure and remote connections, as well as collection, storage, analysis, and visualization of data about each inverter, photovoltaic power plant, and network.

Centralized overview of photovoltaic stations
SLD (Single Line Diagram)
Inverters field
Inverters field
Forecast and real energy production historical trend
HV voltage historical trends

Industrial monitoring · OEE

Equipment utilization (OEE)

Project parameters

Number of measurement points
> 15
Electrical network analyzers
Socomec DIRIS A10 Socomec DIRIS A20
Network equipment
MikroTik KNOT
Software and tools
Ubuntu Linux Zabbix Grafana Python

Project description

Equipment utilization monitoring for production machinery such as CNC machines, presses, and paint booths is implemented by measuring electrical current and determining the operating mode from its magnitude.

Each measurement point can be in one of three modes: off, idle, or operational. Analysis of current values from the network analyzers identifies downtime and operating periods across a shift, day, or week. Results appear on clear dashboards and update in real time.

In OEE (Overall Equipment Effectiveness) terminology, the system calculates the availability criterion, a fundamental input for further OEE calculations. Availability depends on different types of downtime, including breakdowns and failures, lack of raw materials, or lack of operator attention.

Advantages

  • Automatic operating mode detection eliminates the human factor and requires no operator action.
  • No intervention in the machine’s electrical circuit is needed.
  • Integrates with ammeters, electricity meters, and network analyzers equipped with a digital output.
Equipment utilization dashboard
Equipment utilization overview
Equipment modes map
Equipment modes map
OEE monitoring view 5

Industrial energy monitoring

Monitoring the power supply of a production site with multiple sources and end-users
Project parameters

Number of measurement points
> 10
Electrical network analyzers
Socomec DIRIS A20 Socomec Digiware
Network equipment
MikroTik KNOT
Software and tools
Ubuntu Linux TimescaleDB Grafana Python

System configuration

The monitoring system covers a production site supplied by multiple sources and serving multiple end-users. The electrical equipment includes:

  • Low-voltage input from the substation.
  • Genset.
  • Photovoltaic power plant.
  • Automatic transfer switch (ATS).
  • End-user measurement points.

The substation, genset, and photovoltaic plant inputs are monitored by Socomec DIRIS A20 network analyzers with RS485 communication modules using Modbus RTU. The ATS controller connects through a MikroTik KNOT Modbus RTU/TCP gateway. End-user metering points are monitored by the Socomec Digiware system.

Python scripts write parameter values directly to a database hosted on a separate virtual machine.

Parameters collected at each measurement point

  • Phase-to-neutral voltages.
  • Phase-to-phase voltages.
  • Phase currents.
  • Per-phase active and reactive power.
  • Average voltage and current.
  • Total active, reactive, and apparent power.
  • Total harmonic distortion (THD) for voltage and current.
  • Power factor, averaged and by phase.
  • Import and export energy counters for active, reactive, and apparent energy.
  • Connection quality.

ATS parameters saved to the database

  • Operating mode.
  • Status code.
  • Error code.
  • Voltage on both inputs.
  • I/O state.

Grafana dashboards

  • Current electrical parameters for end-users.
  • Current ATS and genset parameters.
  • Trends and historian.
  • Power consumption report for each measurement point.
Electrical measurements overview
Grid input, Genset and STS monitoring
Power consumption report
Historical trends
Historical trends

Industrial energy monitoring

Industry power supply monitoring

Project parameters

Number of measurement points
6 (source input + 5 PDPs)
Electrical network analyzers
Socomec DIRIS A20
Network equipment
MikroTik KNOT
Software and tools
Ubuntu Linux Zabbix Grafana TimescaleDB

System configuration

The monitoring system supervises the power supply of a medium-sized factory. It consists of a low-voltage source input measurement point and five power distribution panels (PDPs) distributed across the site.

Each measurement point uses a Socomec DIRIS A20 with an RS485 communication module (Modbus RTU). A MikroTik KNOT gateway connects the analyzers using Modbus RTU/TCP.

Python scripts send parameter values to Zabbix and store them in a database hosted on a separate virtual machine.

Parameters collected at each measurement point

  • Phase-to-neutral voltages.
  • Phase-to-phase voltages.
  • Phase currents.
  • Per-phase active and reactive power.
  • Average voltage and current.
  • Total active, reactive, and apparent power.
  • Total harmonic distortion (THD) for voltage and current.
  • Power factor, averaged and by phase.
  • Import and export energy counters for active, reactive, and apparent energy.
  • Connection quality.

If measurements exceed defined limits, Zabbix can send alerts by email, SMS, or messenger.

Grafana dashboards

  • Power by measurement point and total power.
  • Current values for every measurement point.
  • Trends and historian.
  • Power consumption report for each measurement point.
Power consumption report
Historical trends
Historical trends
Measure point overview
Factory power monitoring overview

Industrial heating · SCADA

SCADA system for heating at a printing company

Project parameters

Zenon SCADA version
6.51
Number of variables
128
Communication protocols
Modbus TCP CODESYS

Project description

The SCADA system configures and controls heating at a printing company consisting of two office buildings and two production buildings. Each room has its own heating circuit with a pump and temperature sensor, controlled by an individual controller.

Implemented features

  • Overview screen showing room temperatures and the operating modes of heating circuits.
  • Circuit configuration screens for hour-by-hour daily schedules, weekend operating modes, and manual control.
  • Charts showing room temperatures and heating circuit pump operation.
Heating system overview
Heating loop settings

Pharmaceutical · Climate control

SCADA system for climate control at a pharmaceutical facility

Project parameters

Zenon SCADA version
6.51
Number of variables
256
Communication protocol
Modbus TCP/RTU

Project description

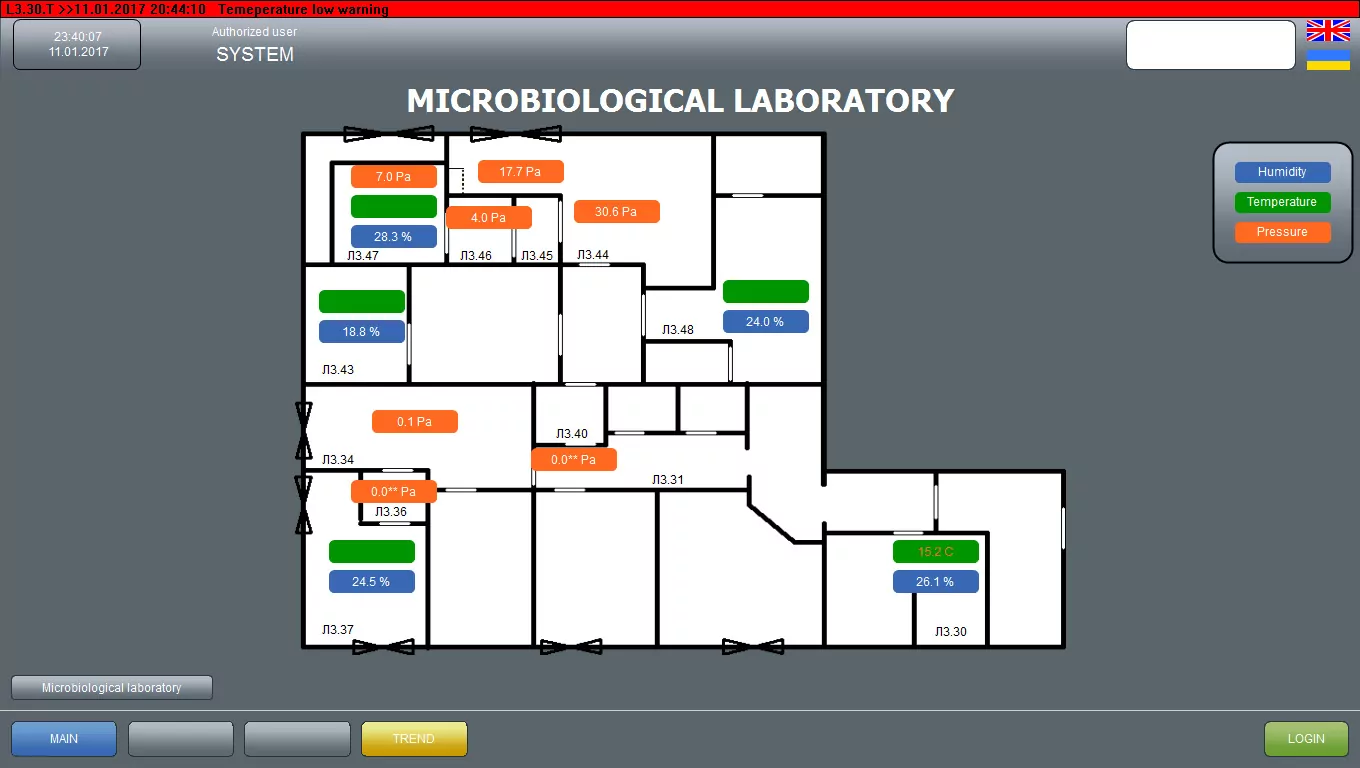
Cleanliness and indoor climate are critical during the production and storage of medicines. Temperature and humidity are monitored in the rooms. In cleanrooms, the system also measures the positive air pressure supplied to prevent dust from entering.

Implemented features

  • Room layouts with visualized measurement values.
  • Data archiving and trend charts.
  • Alarm log.
  • Reports on measurement deviations.
  • SMS notifications for alarm conditions.
Climate monitoring overview
Cleanroom conditions
Historical Trend
Historical Trend
AML (Alarm Message List)

Energy monitoring · Commercial building

Power supply monitoring for an office center

Project parameters

Number of electrical inputs
4
Network analyzers
Socomec DIRIS A20
Software
Windows MySQL PHP

Project description

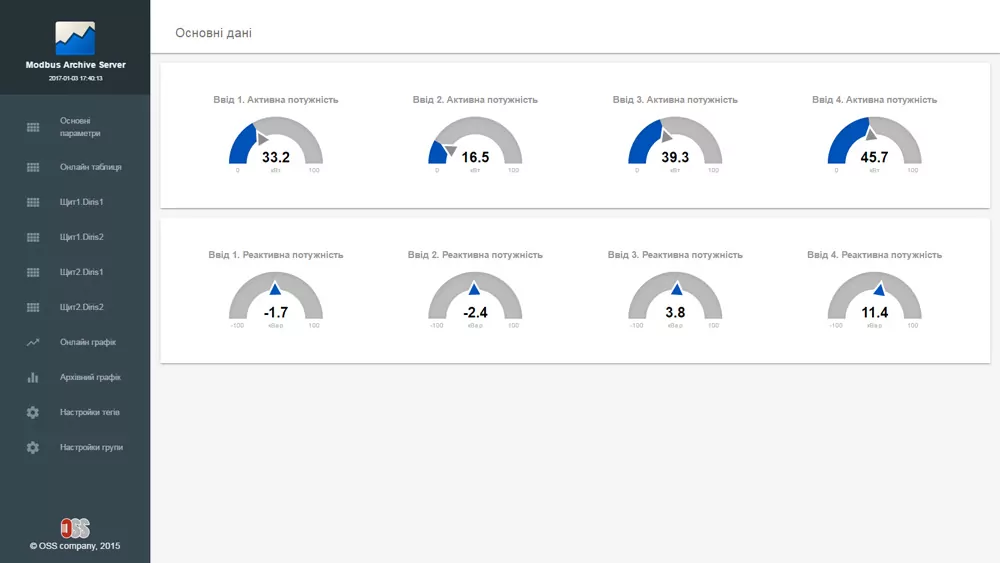
The system monitors the power supply of an office center with four electrical inputs. It stores the main electrical parameters, including phase and phase-to-phase voltages, currents, active, reactive and apparent power, power factor, and meter readings.

The status of all four automatic transfer switches (ATS) is also recorded, including switch position and the generator start signal.

The interface provides

  • A table of current parameter values.
  • Historical and real-time charts.
  • A dashboard with selected parameters.
Historical electrical parameter trend
Power monitoring dashboard
Online measurement values

Industrial production monitoring

Stamping press production monitoring

Project parameters

PLC
VIPA SLIO
Software and tools
Ubuntu Linux MySQL PHP Python

Project description

The system records the number of parts produced by a stamping press. The part type is detected automatically in the PLC program according to the installed die. Accumulated counter values are read from the PLC at regular intervals and stored in a database.

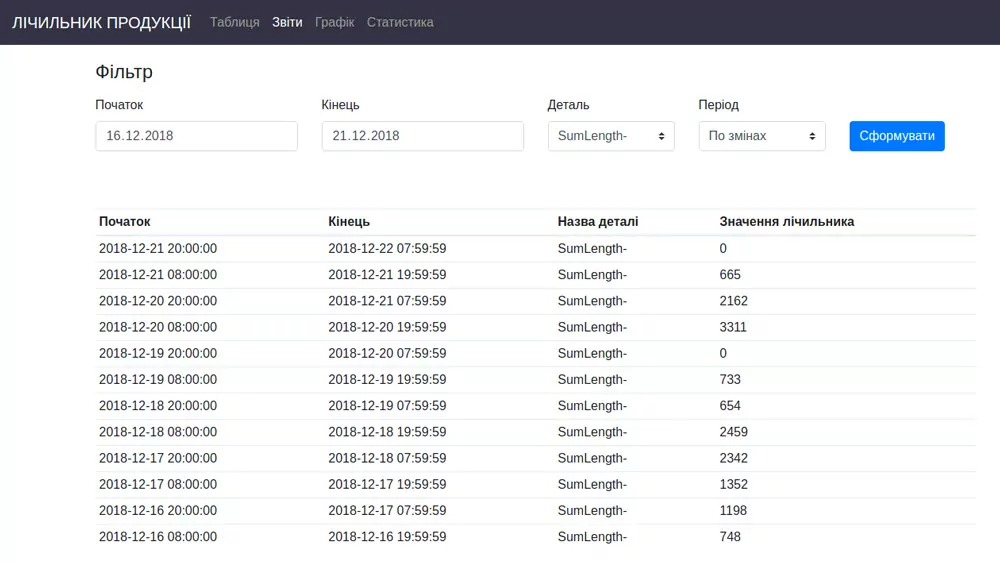
Reports generated from the accumulated data

  • Production output (number of parts produced) for a selected period.
  • Amount of material used.
  • Number of parts produced in a selected period, grouped by part type.
  • Downtime.
Production monitoring overview
Production report view 2
Production report view 3
Production report view 4
Production report view 5
Production report view 6

Industrial process monitoring

Hardening furnace monitoring

Project parameters

Number of measurement points
6
Communication protocol
Modbus
Software
Windows MySQL PHP Grafana

Project description

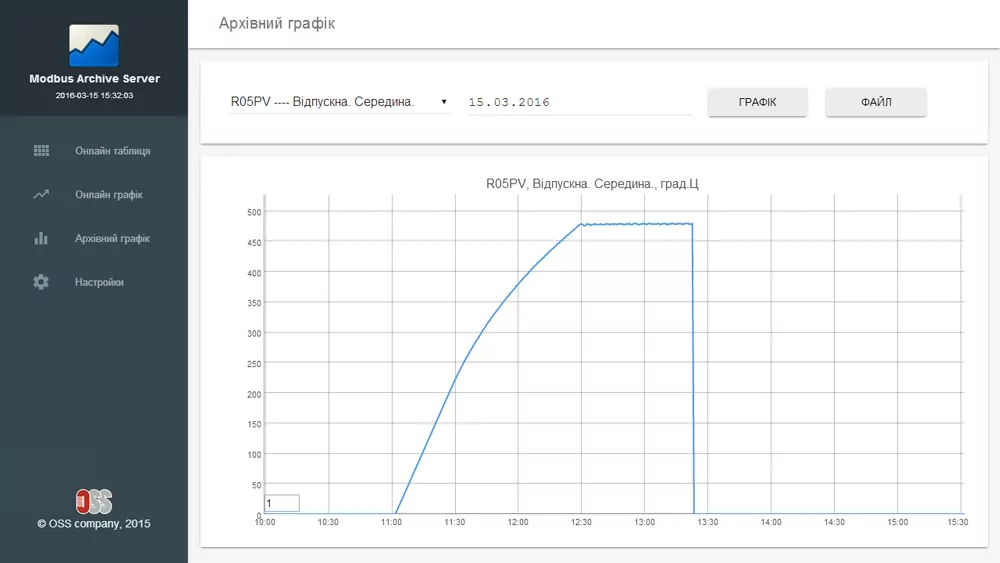
The system monitors the temperature profiles of a hardening furnace. Current and setpoint temperatures from six measurement points are read over Modbus and stored in a database.

The interface allows users to

  • View real-time values with indication when they exceed permitted limits.
  • View current and historical charts.
  • Change settings.
Furnace measurement settings
Historical temperature trend
Furnace monitoring screen

Let’s work together

Ready to start a project?

Tell us about your facility — we’ll find the optimal solution.